Welcome to my Portfolio
Hi, I’m Camilo! I’m a BI Analyst and MBA candidate. This is a brief overview of each of my projects, you can check the complete work by clicking on it. Contact me directly through my LinkedIn or send me an email to 📩 camilo.estrada.14@gmail.com
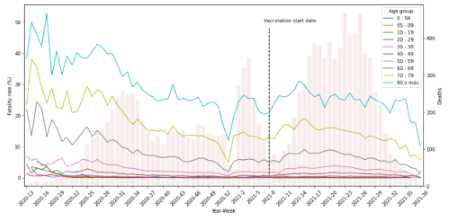
Project 1: Effect of Vaccines on Covid-19 fatality rate in Colombia
- This project was made in order to understand the effects of mass vaccination on the fatality rate in Colombia, and determine if there really is a positive impact on vaccinated population.
- Data: Covid-19 positive cases data in Colombia from the National Institute of Health (4.9M records). Vaccination data extracted from the official Our World in Data repository (208 rows).
- Tools: SQL Server for ETL and data exploration (SQL queries). Python for explanatory analysis on a Jupyter notebook.
- During the first six months after the start of vaccination, fatality rate has slightly decrease and it is only noticeable after the seventh month (09-2021). In the last two months fatality rate has decreased by 28% on average.
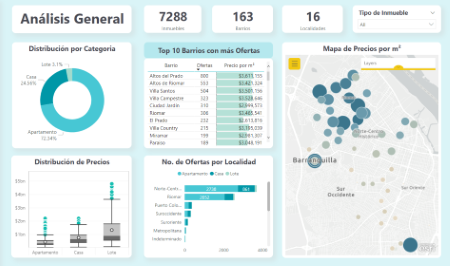
Project 2: Real Estate Market Analysis in the city of Barranquilla, CO
- Exploratory data analysis of the real estate offers in the city, getting a better undestanding of the market and allowing agents to make more precise estimates on the valuation of each sector.
- Data: Extracted from metrocuadrado.com through web scraping (7288 records).
- Tools: Octoparse for web scraping; Power BI/DAX for ETL, data modeling and visualization.
- It is found that the real estate market is growing mainly towards the north of the city, as you can find there the largest number of offers per sector and the highest valuations of price per square meter.
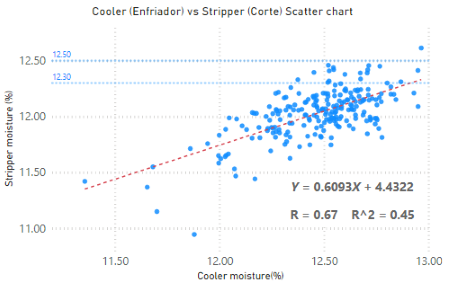
Project 3: Pasta Moisture Data Analysis
- In this research work, a deep analysis on the moisture data of pasta in a food factory was carried out, in order to answer questions and help make decisions to improve the efficiency of the pasta drying process.
- Data obtained from moisture testers through an IOT data capture system and stored on a csv file (+14K records).
- Tools: Power BI and Excel for ETL and visualizations, Infostat for statistics.
- An insightful Power BI report was built and recommendations made it possible to improve the efficiency of the pasta drying process by 12%.
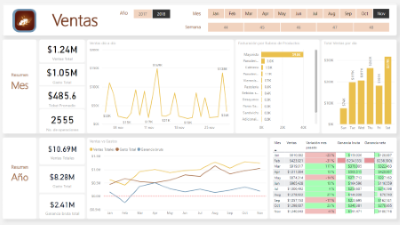
Project 4: Dashboard Catalog
A collection of previous dashboard projects I have built through this journey:
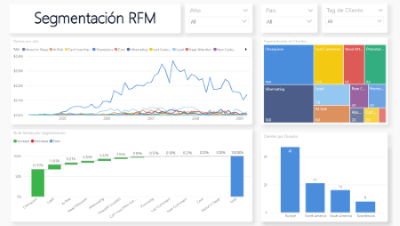
- RFM Analysis Dashboard (PowerBI/Excel)
- Bakery Sales Dashboard (PowerBI/Excel)